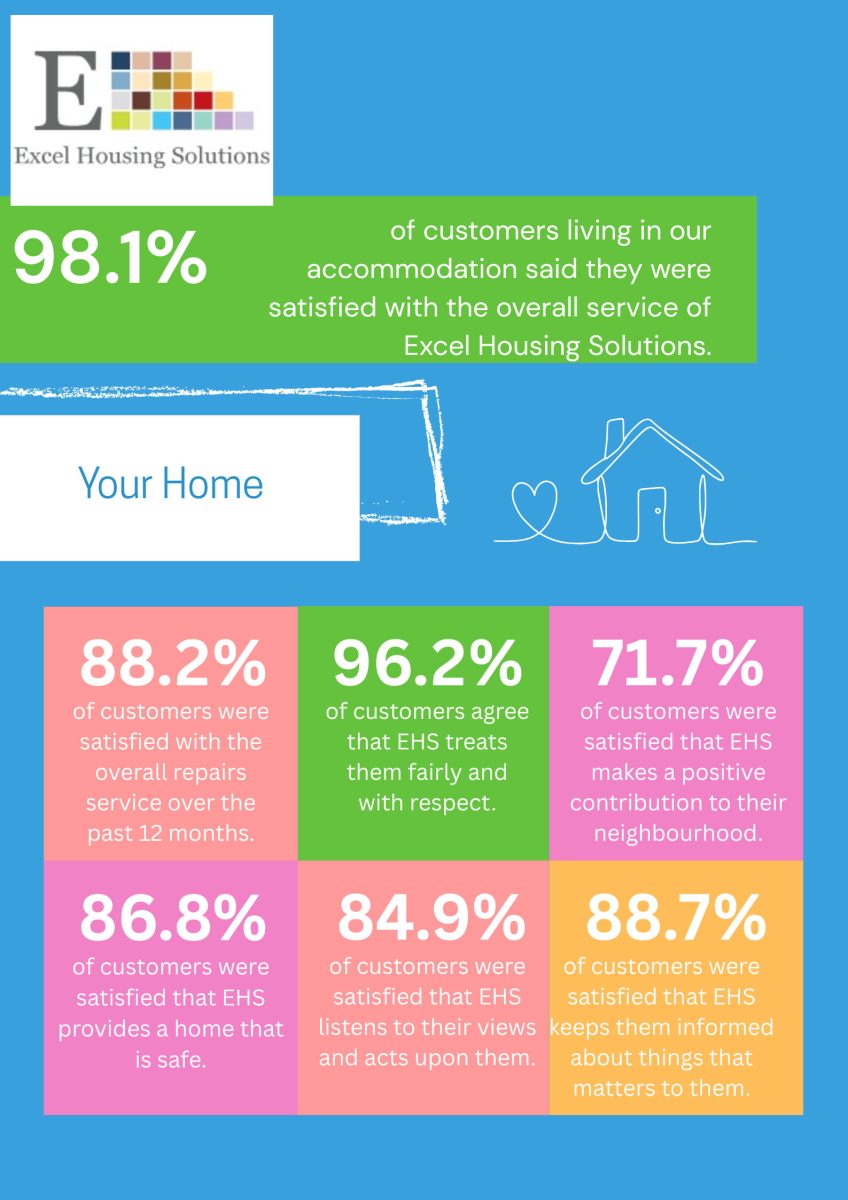
|
3. TP01 – Taking |
|||||
|
Answer |
Response Percent |
Response Total |
|||
|
1 |
Very |
|
70.37% |
38 |
|
|
2 |
Fairly |
|
27.78% |
15 |
|
|
3 |
Neither |
|
1.85% |
1 |
|
|
4 |
Fairly |
0.00% |
0 |
||
|
5 |
Very |
0.00% |
0 |
||
|
answered |
54 |
||||
|
skipped |
0 |
||||
|
4. TP02 – Has Excel |
|||||
|
Answer |
Response Percent |
Response Total |
|||
|
1 |
Yes |
|
64.81% |
35 |
|
|
2 |
No |
|
35.19% |
19 |
|
|
answered |
54 |
||||
|
skipped |
0 |
||||
2. Home Repair
|
5. TP02 – How |
|||||
|
Answer |
Response Percent |
Response Total |
|||
|
1 |
Very |
|
62.86% |
22 |
|
|
2 |
Fairly |
|
25.71% |
9 |
|
|
3 |
Neither |
|
2.86% |
1 |
|
|
4 |
Fairly |
|
8.57% |
3 |
|
|
5 |
Very |
0.00% |
0 |
||
|
answered |
35 |
||||
|
skipped |
19 |
||||
3. Main Questions 2
|
6. TP03 – Has Excel |
|||||
|
Answer |
Response Percent |
Response Total |
|||
|
1 |
Yes |
|
100.00% |
35 |
|
|
2 |
No |
0.00% |
0 |
||
|
answered |
35 |
||||
|
skipped |
19 |
||||
4. Home Repair time taken
|
7. TP03 – If yes, |
|||||
|
Answer |
Response Percent |
Response Total |
|||
|
1 |
Very |
|
62.86% |
22 |
|
|
2 |
Satisfied |
|
25.71% |
9 |
|
|
3 |
Neither |
|
8.57% |
3 |
|
|
4 |
Dissatisfied |
|
2.86% |
1 |
|
|
5 |
Very |
0.00% |
0 |
||
|
answered |
35 |
||||
|
skipped |
19 |
||||
5. Main questions
|
8. TP04 – How |
|||||
|
Answer |
Response Percent |
Response Total |
|||
|
1 |
Very |
|
64.81% |
35 |
|
|
2 |
Satisfied |
|
25.93% |
14 |
|
|
3 |
Neither |
|
9.26% |
5 |
|
|
4 |
Dissatisfied |
0.00% |
0 |
||
|
5 |
Very |
0.00% |
0 |
||
|
answered |
54 |
||||
|
skipped |
0 |
||||
|
9. TP05 – Thinking |
|||||
|
Answer |
Response Percent |
Response Total |
|||
|
1 |
Very |
|
62.96% |
34 |
|
|
2 |
Satisfied |
|
24.07% |
13 |
|
|
3 |
Neither |
|
9.26% |
5 |
|
|
4 |
Dissatisfied |
|
3.70% |
2 |
|
|
5 |
Very |
0.00% |
0 |
||
|
answered |
54 |
||||
|
skipped |
0 |
||||
|
10. TP06 – How |
|||||
|
Answer |
Response Percent |
Response Total |
|||
|
1 |
Very |
|
51.85% |
28 |
|
|
2 |
Satisfied |
|
33.33% |
18 |
|
|
3 |
Neither |
|
14.81% |
8 |
|
|
4 |
Dissatisfied |
0.00% |
0 |
||
|
5 |
Very |
0.00% |
0 |
||
|
answered |
54 |
||||
|
skipped |
0 |
||||
|
11. TP07 – How |
|||||
|
Answer |
Response Percent |
Response Total |
|||
|
1 |
Very |
|
55.56% |
30 |
|
|
2 |
Satisfied |
|
33.33% |
18 |
|
|
3 |
Neutral |
|
11.11% |
6 |
|
|
4 |
Dissatisfied |
0.00% |
0 |
||
|
5 |
Very |
0.00% |
0 |
||
|
answered |
54 |
||||
|
skipped |
0 |
||||
|
12. TP08 – To what |
|||||
|
Answer |
Response Percent |
Response Total |
|||
|
1 |
Very |
|
70.37% |
38 |
|
|
2 |
Satisfied |
|
25.93% |
14 |
|
|
3 |
Neither |
|
3.70% |
2 |
|
|
4 |
Dissatisfied |
0.00% |
0 |
||
|
5 |
Very |
0.00% |
0 |
||
|
answered |
54 |
||||
|
skipped |
0 |
||||
|
13. TP09 – Have you |
|||||
|
Answer |
Response Percent |
Response Total |
|||
|
1 |
Yes |
|
29.63% |
16 |
|
|
2 |
No |
|
70.37% |
38 |
|
|
answered |
54 |
||||
|
skipped |
0 |
||||
6. Complaints
|
14. TP09 – If yes, How satisfied or dissatisfied are you with Excel Housing |
|||||
|
Answer |
Response Percent |
Response Total |
|||
|
1 |
Very |
|
37.50% |
6 |
|
|
2 |
Satisfied |
|
37.50% |
6 |
|
|
3 |
Neither |
|
18.75% |
3 |
|
|
4 |
Dissatisfied |
|
6.25% |
1 |
|
|
5 |
Very |
0.00% |
0 |
||
|
answered |
16 |
||||
|
skipped |
38 |
||||
7. Main questions 3
|
15. TP10 – Do you |
|||||
|
Answer |
Response Percent |
Response Total |
|||
|
1 |
Yes |
|
79.63% |
43 |
|
|
2 |
No |
|
20.37% |
11 |
|
|
3 |
Don’t |
0.00% |
0 |
||
|
answered |
54 |
||||
|
skipped |
0 |
||||
8. Communal Areas
|
16. TP10 – If yes, |
|||||
|
Answer |
Response Percent |
Response Total |
|||
|
1 |
Very |
|
65.12% |
28 |
|
|
2 |
Satisfied |
|
25.58% |
11 |
|
|
3 |
Neither |
|
9.30% |
4 |
|
|
4 |
Dissatisfied |
0.00% |
0 |
||
|
5 |
Very |
0.00% |
0 |
||
|
answered |
43 |
||||
|
skipped |
11 |
||||
9. Main questions
|
17. TP11 – How |
|||||
|
Answer |
Response Percent |
Response Total |
|||
|
1 |
Very |
|
42.59% |
23 |
|
|
2 |
Satisfied |
|
29.63% |
16 |
|
|
3 |
Neither |
|
27.78% |
15 |
|
|
4 |
Dissatisfied |
0.00% |
0 |
||
|
5 |
Very |
0.00% |
0 |
||
|
answered |
54 |
||||
|
skipped |
0 |
||||
|
18. TP12 – How |
|||||
|
Answer |
Response Percent |
Response Total |
|||
|
1 |
Very |
|
48.15% |
26 |
|
|
2 |
Satisfied |
|
44.44% |
24 |
|
|
3 |
Neither |
|
7.41% |
4 |
|
|
4 |
Dissatisfied |
0.00% |
0 |
||
|
5 |
Very |
0.00% |
0 |
||
|
6 |
Not |
0.00% |
0 |
||
|
answered |
54 |
||||
|
skipped |
0 |
||||
